.ksh Files
Table of Contents
.ksh Format
.ksh files are essentially just text that any text editor can read. Upon opening a .ksh file, you will be greeted with something like this.
title=1001 -ESCAPE-
artist=SOUND HOLIC feat. Nana Takahashi
effect=MASON -ESCAPE-
jacket=cannonballers.jpg
illustrator=
difficulty=infinite
level=19
t=147
m=music.mp3
mvol=75
o=0
bg=cyber
layer=snow;1100;1
po=0
plength=15000
pfiltergain=50
filtertype=peak
chokkakuautovol=0
chokkakuvol=50
ver=171
--
beat=4/4
0000|00|--
--
0000|20|--
0100|00|--
0010|00|--
0001|00|--
0000|20|--
0010|00|--
0100|00|--
1000|00|--
0000|02|--
0100|00|--
0010|00|--
1000|00|--
0001|00|--
0000|02|--
0100|00|--
0010|00|--
This is what the first part of the chart 1001 escape looks like. There is a lot of information here, so let’s break it down.
Syntax of .ksh
Let’s first break down how .ksh files work. Every .ksh is broken off into sections. This is shown by a line that only has --. When there is a new line with --, that means that you are at the end of the old section and entering a new section. Excluding the first section, all sections can be different lengths and as long or short as they need to be (to a limit that most likely won’t be reached).
In every .ksh file, the first section is always metadata about the chart.
Metadata
For right now, we will look at this section of the data
title=1001 -ESCAPE-
artist=SOUND HOLIC feat. Nana Takahashi
effect=MASON -ESCAPE-
jacket=cannonballers.jpg
illustrator=
difficulty=infinite
level=19
t=147
m=music.mp3
mvol=75
o=0
bg=cyber
layer=snow;1100;1
po=0
plength=15000
pfiltergain=50
filtertype=peak
chokkakuautovol=0
chokkakuvol=50
ver=171
Most of this is all metadata that is set in the editor for each chart. While most are self-explanatory, some ones aren’t as easy to understand.
t= The starting BPM of the song. This does not account for changes in BPM.o= Millisecond offset of the song.layer= Foreground layer, not backgroundpo= Sample offset. This is not the offset of the song, but rather just the offset of the sample that plays when you hover over the song.plength= Sample lengthpfiltergain= Sample filterver= Version of the editor/KSM that this chart was made for or made on.
It’s important to note that you can leave metadata blank, and it will be ok. For example, this chart does not have an illustrator attached, but is still fine.
Chart and Notes
The next section of the file is where the chart starts. From here on out, most of the file will look the same. Let’s start with the first section.
--
beat=4/4
0000|00|--
--
Here, we have two lines: beat=4/4 and 0000|00|--|. The first line is simple; it defines the current time signature. If the time signature were to change, there would be a beat= to signify this change. This goes the same with t= (BPM) as well. If there is a BPM change, it will be signified in the file like this. You can change the BPM and time signature as much as you want.
The next time is what’s placed in the chart. Here, each line has 3 sections divided by |. The first section, or the 4 numbers, represent the BT/White notes. The next section represents the FX/Orange notes. This only has 2 numbers. The last section is the laser. For now, let’s look at the first 2 since they are very similar.
0000|00A note is represented by each number. Each number can either be a 0 or a 1.
- 0 represents nothing. Meaning there are no notes.
- 1 represents a bt note. Meaning there is a bt note.
- 2 represents a bt hold note. Meaning there is a bt hold.
FX are slightly different
- 0 represents nothing. Meaning there are no notes.
- 1 represents a fx hold. Meaning there is a fx hold.
- 2 represents a fx note. Meaning there is a fx note.
So, for example, if a line looked like 1000|00, there would be one note in the first lane. This is the same thing for FX as well, except there are only 2 positions a FX note can be in. Here are some more examples.
1000|000010|000101|000000|201100|02
Laser
Before explaining lasers, I’d like to explain more about how the KSM editor works. Lasers have a set point where you can put them in the KSM editor. Meaning, you can’t just place a laser anywhere you want. Each laser has to start or end at one of these “points”. These points go from left to right and are represented by a character in the .ksh file. Starting at 0, which is the farthest left point, it goes 0-9, then A-Z uppercase, and then a-o lowercase, with o being the farthest right.
You can think of this as a long number line with 0 being the last number on the number line or farthest left, and o being the last number on the line or the farthest right.
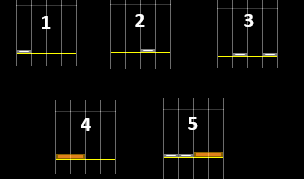
There are 2 characters that represent the left/blue laser and the right/red laser respectively in a line. For now, let’s look at this.
0000|00|--
0000|00|--
0000|00|0-
0000|00|:-
0000|00|:-
0000|00|:-
0000|00|:-
0000|00|:-
0000|00|o-
0000|00|--
0000|00|--
0000|00|--
0000|00|-o
0000|00|-:
0000|00|-:
0000|00|-:
0000|00|-:
0000|00|-:
0000|00|-P
0000|00|-:
0000|00|-:
0000|00|-:
0000|00|-:
0000|00|-:
0000|00|-o
0000|00|--
I have removed the section indicators (--) to make it a bit easier to read.
There are 2 characters we haven’t gone over yet when it comes to lasers. These are the - and :.
-represents that there is no laser currently.:represents that there is a laser.
Let’s look at the left laser for now. To start a laser, there has to be a starting point. For this example, this is 0. This means that the laser starts at the farthest left point. The next line is a : which means the laser is continuing/exist. This continues until we reach an o. This is the farthest right point, meaning the laser is now at the farthest right. The next line shows a -, meaning the laser has ended. All in all, that means this laser goes 0 or the farthest left to the farthest right or o in a straight line.
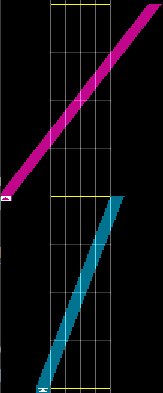
Let’s look at the right laser now. This starts at o or the farthest right and then goes P. While we don’t know exactly where this is, we can assume this is around the middle. This means the laser makes a straight line to the middle. The next line is a : meaning that this laser is continuing and not ending. A couple more lines later, we get an o meaning the laser has returned to the far right. The line after this is a -, meaning the laser has ended. All in all, we can assume this laser starts on the right, heads to around the middle, and then heads back to the right.
Here is what the above example looks like in the editor.
Measures
Let’s talk more about sections and the format of .ksh. Each .ksh file is divided into sections, divided by --. You may have noticed this in the original example. For now, let’s look at this.
--
1000|00|--
0100|00|--
0010|00|--
0001|00|--
--
1000|00|--
0100|00|--
0010|00|--
0001|00|--
1000|00|--
0100|00|--
0010|00|--
0001|00|--
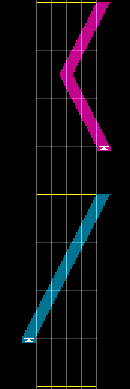
--As you can see, this part has 2 sections. One with 4 lines and one with 8 lines. These sections represent measures. So, each section is a measure. In this example, I am showing 2 measures of this chart. We are also going to assume that this is using a standard 4/4 time signature, meaning every measure has 4 beats.
Each measure can have a different number of lines. How many lines it is is determined by whatever measure is the highest x-th note. For example, let’s look at the first measure. There are 4 lines. This means that the highest x-th notes that are used in this measure are 4th notes (i.e, a note can be placed on the beat). Here, using the knowledge that we know, we can know that this measure has 4 notes in a staircase pattern, with each note being at the beginning of every beat.
The next section has 8 lines instead of 4. This means that the highest x-th note is 8th notes (i.e, a note can be placed on the beat and halfway through the beat). Here, we see that there is also a staircase, but it is a bit faster since they are being played as 8th notes.
Here is what the above example looks like in the editor
In the editor, each measure is separated by the yellow line. So, the bottom half is the 4-line part, and the top half is the 8-line part.
Slams and other small things
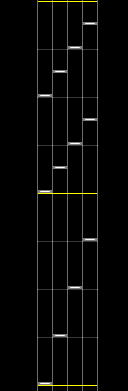
There are a couple of other things to note. First slams. In KSM, a slam is a laser that goes from one point to the other as fast or faster than a 32nd of a second. So, for example:
...
0000|00|--
0000|00|0-
0000|00|o-
0000|00|--
...
Let’s assume that this measure had 32 lines, meaning that it was in 32nd notes. This laser would go from the left side to the right side in a 32nd. This would become a slam as a laser that moves from one point to another as fast or faster than a 32nd turns into a slam.
 Above example in editor
Lasers can also be extended beyond their normal range. Normally, the farthest left it can be is right next to the lane. But, this can be extended much farther. Note that there aren’t more points, just that the points are now extended and farther apart.
--
0000|00|0-
0000|00|:-
0000|00|:-
0000|00|o-
--
laserrange_r=2x
0000|00|-0
0000|00|-:
0000|00|-:
0000|00|-o
--
Let’s look at this. The first measure is a normal blue laser using a normal range. The next measure has a line laserrange_r=2x. This means that the laser range for the right laser is extended. Even though these lasers start and end with the same movement, the right one will be longer. It might be hard to visualize this, so here is what this looks like.
The laserrange only applies for as long as the laser goes. Once the laser ends, the range will be back to normal. Also, changing 2x to 4x or something else doesn’t increase the range further.
This doesn’t only apply to laserrange. Camera effects, FX effects, BPM changes, and other things are done in the middle of the chart. If you understand the format well enough, you can use it to create certain effects that are too hard/impossible to create in the editor.
Footer
There is also can be a footer in a chart. This is simply where custom effects and filters for FX are defined. These looks like:
#define_fx
#define_filter