Scoring
Table of Contents
Normal Score
The default scoring system that ranges from 0 - 10,000,000 for every chart. It is occasionally referred to as “money” score and affects both your VOLFORCE and PLAYER RADAR. Score is calculated by the formula:
10,000,000 * [ (# CRITICAL + [# NEAR * 0.5]) / TOTAL ]- S-CRITICAL hits are counted as CRITICAL hits
TOTALrefers to the total number ofCHIP,LONGandTSUMAMIobjects
Example Calculation
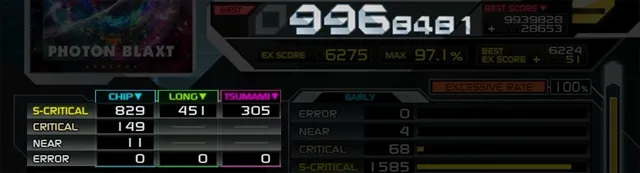
# CRITICAL = # S-CRITICAL + # CRITICAL
           = (829 + 451 + 305) + (149)
           = 1734

# NEAR = 11

TOTAL = # CHIP + # LONG + # TSUMAMI
      = (829 + 149 + 11) + (451) + (305)
      = 1745

10,000,000 * [ (1734 + [11 * 0.5]) / 1745 ] = 9,968,481
Grades
Grades are assigned according to the following score ranges:
| Grade | Score |
|---|---|
| S | 9,900,000 - 10,000,000 |
| AAA+ | 9,800,000 - 9,899,999 |
| AAA | 9,700,000 - 9,799,999 |
| AA+ | 9,500,000 - 9,699,999 |
| AA | 9,300,000 - 9,499,999 |
| A+ | 9,000,000 - 9,299,999 |
| A | 8,700,000 - 8,999,999 |
| B | 7,500,000 - 8,699,999 |
| C | 6,500,000 - 7,499,999 |
| D | 0 - 6,499,999 |
EX SCORE
An alternate scoring system that does not have a fixed range, every chart has a different maximum EX SCORE value. It has no effect on your VOLFORCE but greatly affects your PLAYER RADAR. Unlike normal score, EX SCORE is affected by S-CRITICAL hits, and each judgement is worth different amounts:
| Judgement | Score | |
|---|---|---|
| CHIP | LONG TSUMAMI | |
| S-CRITICAL | 5 | 2 |
| CRITICAL | 4 | - |
| NEAR | 2 | - |
| ERROR | 0 | 0 |
Using the S-CRITICAL score values, the maximum EX SCORE value for a chart is calculated by the formula:
(# CHIP * 5) + ([# LONG + # TSUMAMI] * 2)Related to EX SCORE is the MAX metric, which is the percentage obtained by dividing your EX SCORE by the theoretical maximum. For percentages above 98%, it is presented as MAX-X instead, where X is the absolute difference between your EX SCORE and the theoretical maximum.
Example Calculation
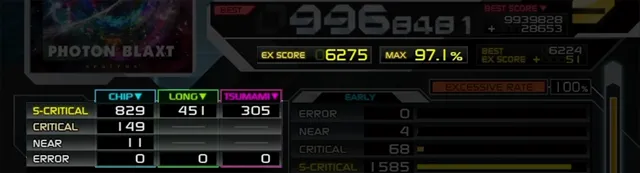
CHIP EX SCORE = (# S-CRITICAL * 5) + (# CRITICAL * 4) + (# NEAR * 2)
              = (829 * 5) + (149 * 4) + (11 * 2)
              = 4763

LONG & TSUMAMI EX SCORE = # S-CRITICAL * 2
                        = (451 + 305) * 2
                        = 1512

TOTAL EX SCORE = CHIP EX SCORE + LONG & TSUMAMI EX SCORE
               = 4763 + 1512
               = 6275

MAX EX SCORE = (# CHIP * 5) + ([# LONG + # TSUMAMI] * 2)
             = ([829 + 149 + 11] * 5) + ([451 + 305] * 2)
             = 6457

MAX = (TOTAL / MAX) * 100%
    = (6275 / 6457) * 100%
    = 97.1%
How should I be scoring?
This section is for normal score only.
How you score depends on many factors, but the main one is how difficult charts are relative to your skill. Chart difficulty is commonly categorized three ways:
- Charts you encounter when breaking into a new level, expect to score
9,000,000 - 9,500,000 - Charts you find moderately difficult, expect to score
9,500,000 - 9,800,000 - Charts in your “comfort zone”, expect to score
9,800,000+
Other factors such as skillset differences and chart composition (charts with high long or tsumami counts are easier to score) may skew scores high or low, but consider how you score on average. If you feel like most of the charts you play fall into category 2 or 3, it is probably safe to try the next level. On the other hand, if you consistently score poorly (on the low end of category 1 or lower), you may not be ready.
These are general baseline scores, it goes without saying that you should try to score as high as you can. Aiming to raise scores or get new grades on charts you’ve played is a good way to stay motivated.